PRACTICAL IMAGE EDITING
Remove Draft Labels From Your Own Chart Template
Remove a draft label from a chart template only when the chart owner has authorized a presentation update and the label is no longer required. Preserve axes, plotted marks, legend mappings and units. This is a template-cleanup task, not a way to improve actual data evidence or infer values hidden behind lettering.
Published 2026-10-16 · Updated
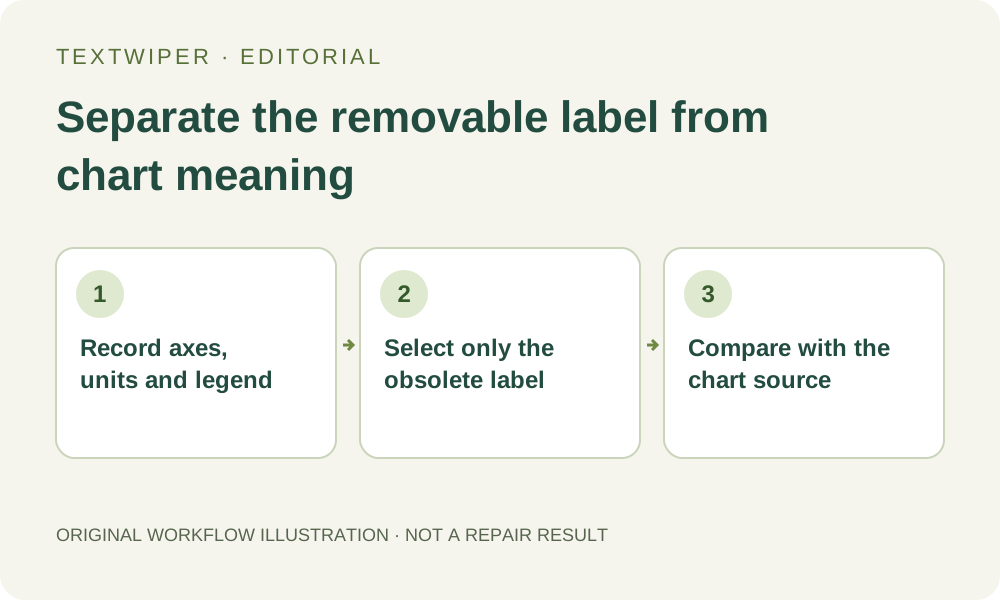
1. Decide whether the draft label is actually obsolete
Ask why the chart is marked draft. If the underlying numbers, methods or approvals remain provisional, removing the label could misrepresent its status. Keep the disclosure until the responsible owner confirms the chart is ready. An attractive image is not evidence that a dataset or an analysis has been reviewed.
For an owned reusable template, keep an untouched original and write a short change note naming the label being removed. If the graph is an actual research result, audit record or decision exhibit, update and export it from the plotting source instead. Do not repair pixels to make uncertain findings appear final.
2. Record the chart elements that carry meaning
Before selecting anything, identify both axes, their direction, scale, tick marks and units. Note the plotted points or bars, error bars, reference lines, category labels and the legend-to-series mapping. Keep this checklist with the source chart or data table, rather than treating the flattened image as a complete numerical record.
Distinguish a draft stamp floating in empty margin space from lettering that overlaps a data mark. A small missing dot might be an observation, not a blemish. TextWiper does not read chart values for verification, reconstruct covered observations or confirm that a repaired tick still means the same quantity.
3. Make a margin-first manual selection
- Open a full-size copy of the template and zoom to the draft label. Start with a portion in empty margin space before attempting anything close to the plotting area.
- Use Brush to cover the letters and their visible shadow. Use Area only when the whole rectangle is clear of ticks, points, grid intersections and required annotations.
- Trim spillover with Erase. Protect nearby axes, tick labels and legend keys, checking that blue protection does not also retain part of the unwanted draft lettering.
- If you choose optional Find text, review its upload-permission prompt before scanning. Detected text boxes locate candidates; they do not classify numbers, verify their values or select only disposable text.
- Try Quick repair on a flat margin. Treat a Smart repair preview near chart geometry with extra caution: a plausible straight line can still differ from the original plotted structure.
- After every mask revision, repair again. Do not use broad automatic cleanup to preserve a graph by assumption; that limited trial may redraw the whole image.
4. Check every meaningful element, not only the cleared word
The full result appears first. Inspect the emptied label area, then deliberately select Show comparison and check the axes, legend keys and nearest data marks against the original. Hide comparison again to review the complete chart. A clean patch is acceptable only if the chart still communicates the same authorized information.
Check for a shortened tick, duplicated grid segment, softened point or color shift that makes two series harder to distinguish. Compare the actual export with the source chart, including its labels and caption. Visual review alone cannot prove numerical equivalence, especially if the removed text originally covered a mark.
5. Hand off an image with an explicit template status
Download PNG and reopen the saved file at its intended presentation size. Keep the source, cleanup copy and change note together. If the template still contains example values or placeholder categories, retain that explanation in the slide or document where it is used; removing one stamp does not turn placeholders into real observations.
Manual selection, repair and download are free during the current beta. They do not include an editable chart, spreadsheet connection or verified data extraction. Finish genuine data updates and regenerate axes in the original plotting application. Do not add a caption implying that TextWiper checked the chart numbers.
6. Stop when the label and data cannot be separated
Stop if a label covers a point, uncertainty bar, logarithmic tick, series boundary or legend symbol and you cannot distinguish what lies underneath. Protect cannot reveal the covered geometry: preserving the input preserves its overlap too. Recreate the chart from the original data and chart settings rather than guessing a convincing shape.
Also stop when removing the draft notice would conceal a required qualification. Obtain approval or keep the notice. This task differs from tidying a flowchart connection: chart positions, scales and mark sizes can encode quantities, so a small cosmetic change may alter the interpretation even when no visible wording changes.